feature
Perth Crime Rates by Suburb — Now on an Interactive Map
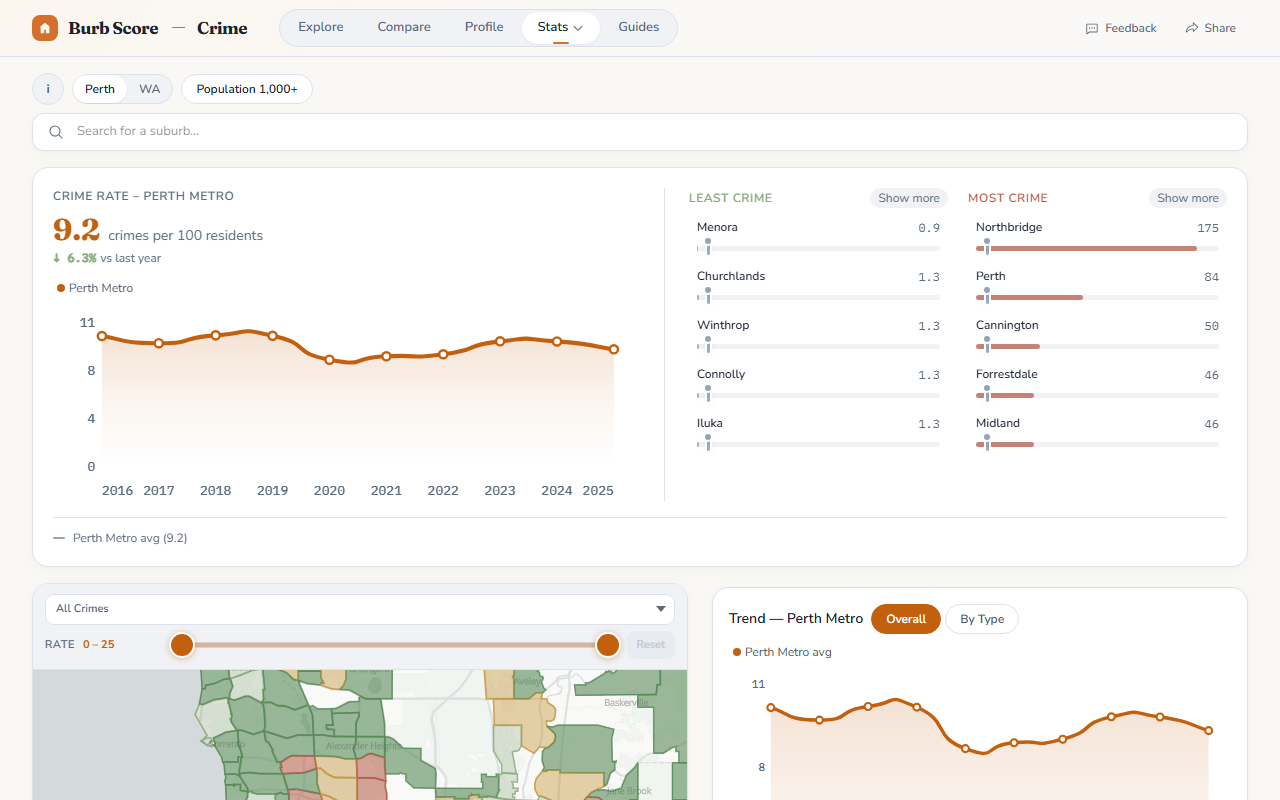
The Crime page now features an interactive heatmap showing per-capita crime rates for every Perth suburb, sourced from official WA Police data.
Each suburb is shaded from green (lowest crime) to red (highest crime rate per capita), giving you an instant visual overview of safety across the metro area.
Filter & explore
- Offence type — filter by violent crime, property crime, drug offences, antisocial behaviour, and more
- Year — compare crime trends year-on-year to see which suburbs are improving
- Population filter — exclude tiny suburbs where a single incident skews the rate
Click any suburb to see the full breakdown of offence categories and how it ranks against the Perth metro average. Combined with our suburb profile pages, this gives you the complete picture on safety before choosing where to live.
Want to know when we ship something new?
Join the newsletter — no spam, just feature updates.